Method for the determination of 16 beta-blockers in milk using Anyeep TQ9120
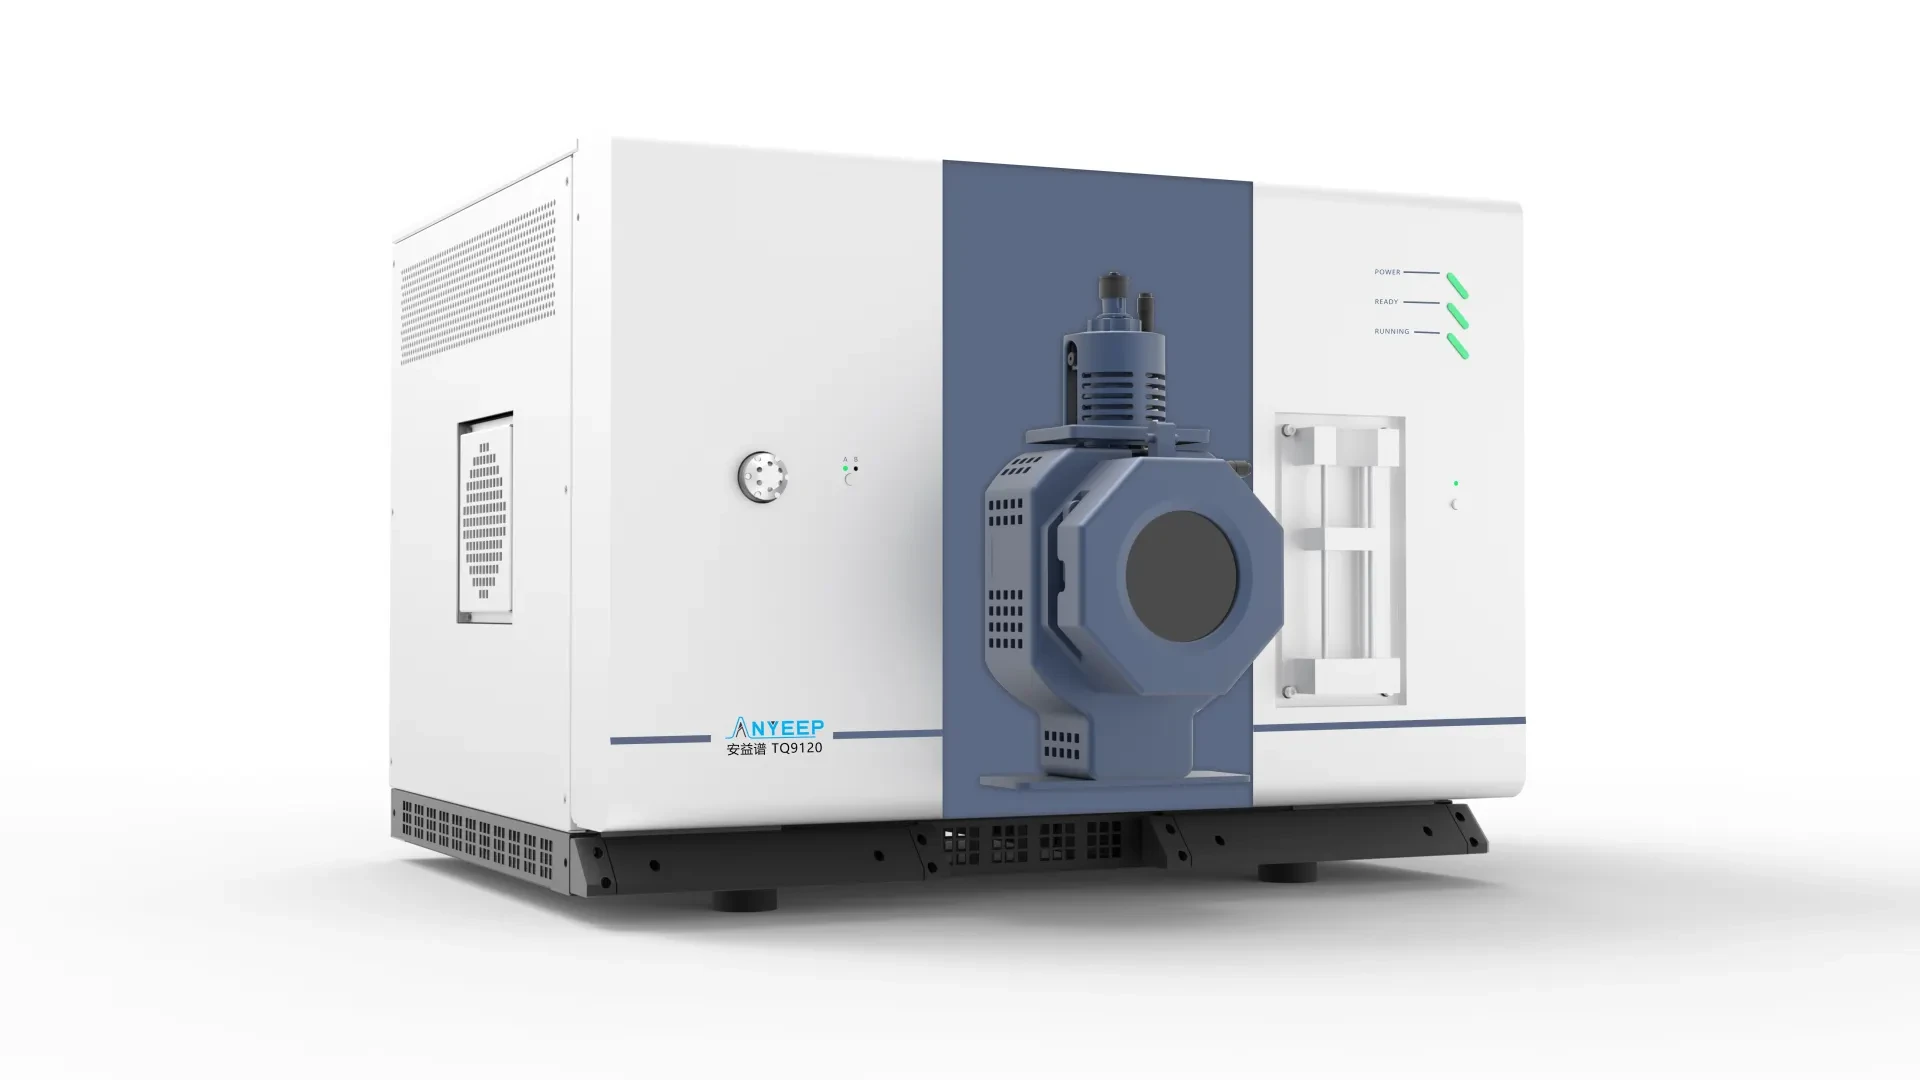
This study establishes a method for the simultaneous detection of 16 β-blockers in milk using Anyeep's TQ9120 ultra-high-performance liquid chromatography-tandem mass spectrometry system. The method demonstrates excellent linearity, with limits of detection and quantification meeting relevant standard requirements. This approach enables reliable identification and quantification of β-blockers using the specified instrumentation.
Introduction
beta-Beta-blockers are a class of drugs widely used to treat cardiovascular conditions such as hypertension, angina, and arrhythmias by competitively blockingbeta-Beta-blockers are adrenergic receptor antagonists that suppress sympathetic nervous activity, reducing heart rate and myocardial contractility. This class includes compounds such as propranolol, metoprolol, bisoprolol, and atenolol, characterized by high structural similarity but varying polarity. Due to their illegal use in livestock feed to promote growth, improve meat quality, increase lean yield, and mask stress responses, these drugs pose a significant risk of abuse in animal husbandry and have become a key focus for food safety monitoring of animal products. China's Ministry of Agriculture and Rural Affairs explicitly prohibits the use of beta-blockers in food-producing animals, establishing strict residue limits and detection methods. Routine testing covers animal-derived matrices including muscle, liver, kidney, milk, and eggs. Relevant standards include GB 31658.22-2022, GB/T 21981-2008, SN/T 1924-2011, Ministry of Agriculture and Rural Affairs Announcement No. 250, and laboratory quality management guidelines under ISO/IEC 17025. This method is based onSN/T 5593-2024Quantified using the internal standard method.
Instruments and Reagents
Anyeep TQ120 Ultra-High Performance Liquid Chromatography-Tandem Mass SpectrometrySystem
Acetonitrile, Methanol(MS-grade, from Thermo Fisher Scientific, USA)
Formic acid (mass spectrometry grade, CNW Technologies, Germany)
Trichloroacetic acid (analytical grade, CNW Technologies, Germany)
Perchloric acid (Industrial grade, CNW GmbH, Germany)
Ammonia (Chromatographic Grade,CNW Company (Germany)
Liquid Chromatography Conditions
Mobile PhaseA:0.1% formic acid solution
Mobile Phase B:0.1% Formic AcidAcetonitrile
Chromatography column:Phenomenex Kinetex F5, 100 Å, 2.6 µm, 3×100 mm
Column Temperature:30 ℃
Flow rate: 0.3 mL/min
Injection volume:5 μL
Mass Spectrometry Conditions
Ionization Source: Electrospray Ionization Source (ESI)+)
Source Temperature: 550 ℃
Spray Voltage: 5000 V
air curtain: 35 psi
Mist gas: 50 psi
Auxiliary Gas: 70 psi
Crash: 8
Scan Mode:MRM
Gradient elution program
Time min | A% | B% | Flow Rate mL/min |
0 | 95 | 5 | 0.3 |
5 | 5 | 95 | 0.3 |
6 | 5 | 95 | 0.3 |
6.1 | 95 | 5 | 0.3 |
9 | 95 | 5 | 0.3 |
Analyte MRM Parameters
No. | Test Item | Q1 Ion | Q3 Ion | CE (V) | DP (V) | Detection Window |
(min) | ||||||
1 | Aprol | 250.2 | 116.2* | 11 | 80 | 4.2 |
|
| 250.2 | 173.2 | 11 | 100 | 4.2 |
2 | Esmolol | 296.2 | 145.2* | 21 | 80 | 3.8 |
|
| 296.2 | 219.1 | 13 | 80 | 3.8 |
3 | Betaxolol | 308.2 | 116.1* | 13 | 80 | 4.1 |
|
| 308.2 | 121.1 | 19 | 80 | 4.1 |
4 | Bisoprolol | 326.2 | 116.2* | 11 | 140 | 3.9 |
|
| 326.2 | 222.2 | 7 | 140 | 3.9 |
5 | Cetolol | 337.2 | 116.1* | 15 | 140 | 3.5 |
|
| 337.2 | 319.2 | 11 | 140 | 3.5 |
6 | Carvedilol | 407.2 | 224.4* | 15 | 120 | 4.6 |
|
| 407.2 | 222.2 | 20 | 140 | 4.6 |
7 | Labetalol | 329.2 | 294.0* | 15 | 100 | 3.9 |
|
| 329.2 | 162.1 | 20 | 80 | 3.9 |
8 | Metoprolol | 268.2 | 116.2* | 10 | 80 | 3.6 |
|
| 268.2 | 191.2 | 10 | 100 | 3.6 |
9 | Nebivolol | 406.2 | 151.1* | 25 | 140 | 4.7 |
|
| 406.2 | 123.0 | 45 | 120 | 4.7 |
10 | propranolol | 292.2 | 236.2* | 10 | 80 | 4.2 |
|
| 292.2 | 201.2 | 15 | 100 | 4.2 |
11 | Propranolol | 260.2 | 116.2* | 10 | 80 | 4.2 |
|
| 260.2 | 183.1 | 10 | 100 | 4.2 |
12 | Celiprolol | 380.2 | 307.2* | 15 | 120 | 3.7 |
|
| 380.2 | 306.3 | 15 | 80 | 3.7 |
13 | Timolol | 317.2 | 261.2* | 15 | 80 | 3.5 |
|
| 317.2 | 244.1 | 15 | 80 | 3.5 |
14 | Oxprenolol | 266.2 | 116.1* | 10 | 80 | 3.9 |
|
| 266.2 | 189.1 | 10 | 100 | 3.9 |
15 | Indenolol | 249.2 | 116.2* | 10 | 80 | 3.5 |
|
| 249.2 | 172.1 | 10 | 80 | 3.5 |
16 | Brimonidine | 292.2 | 236.2* | 10 | 80 | 4.2 |
|
| 292.2 | 201.2 | 15 | 100 | 4.2 |
17 | Metoprolol d7 | 275.2 | 123.2 | 15 | 80 | 3.6 |
18 | Nebivolol D4 | 410.2 | 151.2 | 25 | 140 | 4.7 |
19 | Propranolol d7 | 267.2 | 116.1 | 10 | 100 | 4.2 |
Note: * indicates quantifier ion pairs; detection window is ±0.6 min.
Sample Processing
Sample ProcessingWeigh approximately 2 g of the sample (to the nearest 0.01 g) into a 50 mL centrifuge tube, and add 20.μCombine the internal standard intermediate solution with 8 mL of 3% trichloroacetic acid solution. Vortex to mix, then centrifuge at 8000 r/min for 5 min. Transfer the entire supernatant into a 50 mL centrifuge tube for purification.
Activate the solid-phase extraction cartridge sequentially with 3 mL methanol and 3 mL water. After the sample solution passes through the cartridge, control the flow rate at 1 mL/min to 2 mL/min. Wash the cartridge sequentially with 3 mL of 0.05% perchloric acid solution and 3 mL water, then dry under vacuum. Elute with 3 mL of 5% ammonia in methanol, controlling the flow rate at 1 mL/min to 2 mL/min. Collect the eluate and blow down to near dryness with nitrogen gas at 45 °C. Accurately add 1.0 mL of 0.1% formic acid in acetonitrile to dissolve the residue, and pass through 0.22.μm filter, for determination by liquid chromatography-mass spectrometry/mass spectrometry.
Standard Curve PreparationAccurately pipette appropriate amounts of the standard intermediate solution and internal standard intermediate solution, and dilute them with 0.1% acetonitrile formic acid solution to.beta-The mass concentrations of the receptor antagonists are 0.1.μg/L, 0.2μg/L, 0.5μg/L, 1.0μg/L, 2.0μg/L, 5.0μg/L, 10μg/L, 20μA mixed standard solution in g/L, with the internal standard mass concentration in the mixed working standard solution being 2.0.μg/L.
Linear Range
No. | Test Item | Retention Time min | Limit of Detection mg/kg | Limit of Quantitation mg/kg | Linear Range ng/mL | Linear Equation 1/x2 weighted | correlation coefficient r2 |
1 | Indenolol | 3.465 | 0.5 | 1.5 | 0.1-20 | Y = 2.5194 * X + 0.00603771 | 0.9904 |
2 | Carbunolol | 3.516 | 0.4 | 0.8 | 0.1-20 | Y = 0.988417 * X + 0.0106235 | 0.9948 |
3 | Timolol | 3.536 | 0.5 | 1 | 0.1-20 | Y = 1.51796 * X + 0.00616269 | 0.9922 |
4 | Metoprolol | 3.606 | 2 | 5 | 0.1-20 | Y = 0.82206 * X + 0.00610371 | 0.9955 |
5 | Celiprolol | 3.715 | 1 | 2 | 0.1-20 | Y = 1.20247 * X + 0.00808975 | 0.9936 |
6 | levobunolol | 3.725 | 2 | 5 | 0.1-20 | Y = 4.77994 * X + 0.0695724 | 0.9934 |
7 | Esmolol | 3.774 | 1 | 3 | 0.1-20 | Y = 1.43722 * X + 0.013516 | 0.9983 |
8 | Bisoprolol | 3.843 | 0.5 | 1.5 | 0.1-20 | Y = 4.44378 * X + 0.0204756 | 0.9949 |
9 | Oxprenolol | 3.883 | 1 | 2 | 0.1-20 | Y = 1.98107 * X + 0.00836778 | 0.9948 |
10 | Labetalol | 3.932 | 3 | 7 | 0.1-20 | Y = 0.487325 * X + 0.00223048 | 0.9943 |
11 | Betaxolol | 4.082 | 2 | 5 | 0.1-20 | Y = 1.13646 * X + 0.0010888 | 0.9926 |
12 | Apploir | 4.153 | 1.5 | 4 | 0.1-20 | Y = 2.33838 × X - 0.000316799 | 0.9923 |
13 | Propranolol | 4.183 | 1.5 | 4 | 0.1-20 | Y = 1.87444 * X + 0.0119471 | 0.9911 |
14 | Carvedilol | 4.585 | 2 | 5 | 0.1-20 | Y = 0.903665 * X + 0.00301227 | 0.9948 |
15 | Nebivolol | 4.674 | 1 | 3 | 0.1-20 | Y = 0.957216 * X + 0.00752216 | 0.9942 |
16 | propranolol | 4.684 | 1.5 | 4 | 0.1-20 | Y = 11.2785 × X - 0.00417821 | 0.9952 |
Summary
This study established an ultra-high-performance liquid chromatography-tandem mass spectrometry (UPLC-MS/MS) system using the Anyeep TQ9120 to analyze 16 beta-blockers. The results demonstrate that the method offers excellent sensitivity, stability, and a wide linear range, making it suitable for routine analysis of beta-blockers.